[ Operation Guide ]
■ Trajectory Plot
After outputting acceleration, velocity, and position data, you can plot the trajectory of motion using the position data. Select the time range (start time and end time) for the trajectory plot, and click the "Select" button. The trajectory of motion from the selected start time to the end time will be displayed. If two components are selected for acceleration, a 2D trajectory in a plane will be plotted. If three components are selected, a 3D trajectory in space will be plotted. However, if only one component is selected, the trajectory will not be displayed.
● Trajectory of Circular Motion (2D)
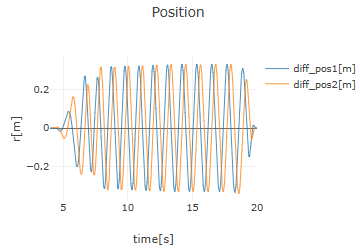
When the position graph of an object undergoing circular motion is obtained as shown in the figure (blue line: $x$ component of position, orange line: $y$ component of position), plotting the trajectory based on the position data from 10 seconds to 15 seconds yields the graph shown below. The black dot on the trajectory (red line) represents the position of the object, while the blue arrow and green arrow originating from the black dot represent the velocity vector and acceleration vector, respectively.
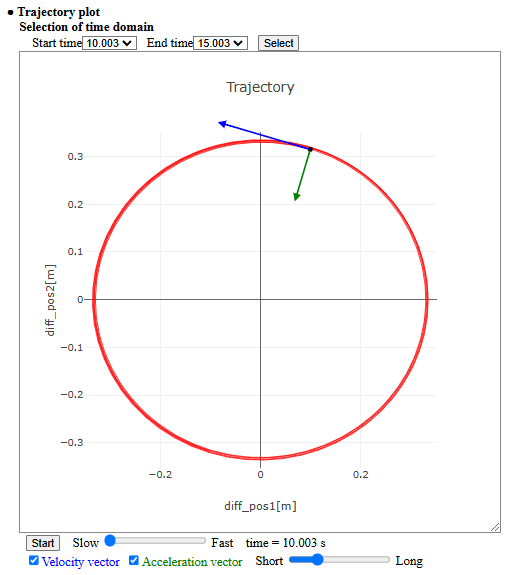
When you press the "Start" button located below the trajectory plot, the motion along the trajectory is displayed as an animation. You can adjust the speed of the animation using the slider to the right of the button. The "Velocity vector" and "Acceleration vector" checkboxes below the "Start" button allow you to toggle the display of these vectors on and off. Additionally, the slider on the right enables you to adjust the length of these vectors.
● Trajectory of Projectile Motion (3D)
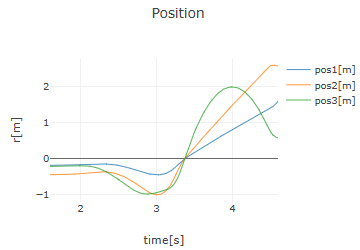
When the position graph of an object undergoing projectile motion is obtained as shown in the figure (blue line: $x$ component of position, orange line: $y$ component of position, green line: $z$ component of position), plotting the trajectory for the position data from 1.6 seconds to 4.6 seconds yields the graph shown below.
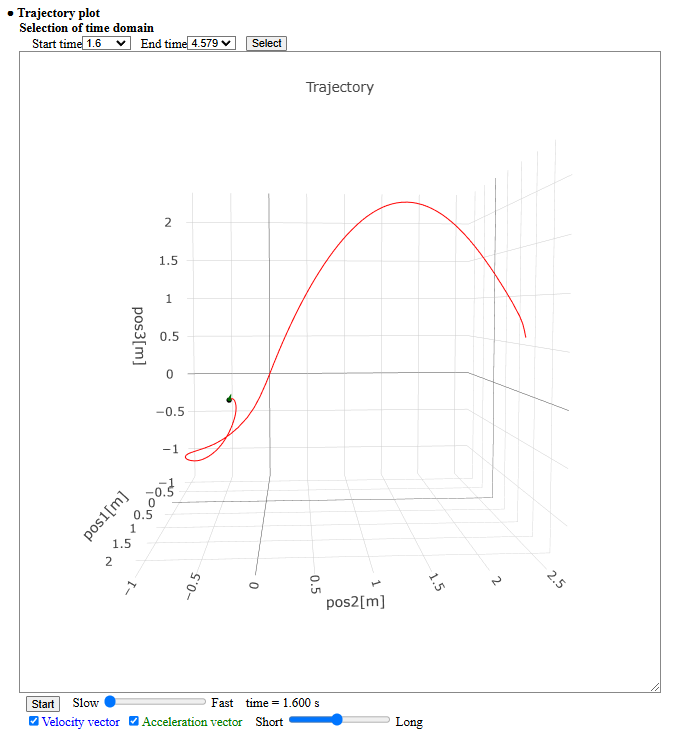
Press the "Start" button below the trajectory plot to display an animation of the motion along the trajectory. The slider to the right of the button can be used to adjust the animation speed. The blue arrow and green arrow originating from the moving black dot represent the velocity vector and acceleration vector, respectively. The "Velocity vector" and "Acceleration vector" checkboxes below the "Start" button allow you to toggle the display of these vectors on and off. Additionally, the slider on the right enables you to adjust the length of these vectors.