[ Operation Guide ]
■ Output Acceleration, Velocity, and Position Data
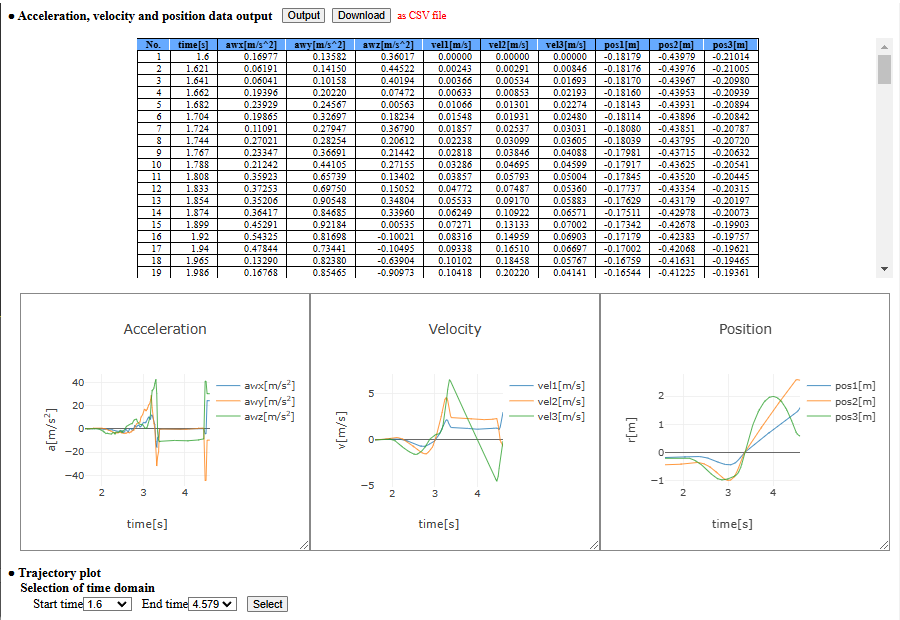
After obtaining position data through numerical integration, a row labeled "● Acceleration, velocity, and position data output" will appear. By clicking the "Output" button on the right, acceleration, velocity, and position data are displayed together in a table, and below it, their corresponding graphs are shown. If multiple components were selected in the acceleration column selection, the data for these components will be overlaid on the graphs.
If data smoothing (e.g., Smoothing by Fourier transform, Smoothing by least-squares approximation) was performed, the selected data among "Original data," "Smoothed data," or "Difference data" will be outputted here.
After outputting acceleration, velocity, and position data, a "Download" button will appear next to the "Output" button. Clicking this button allows the data to be downloaded as a CSV file. Additionally, the outputted position data can be used to plot the motion trajectory. However, if only one component is selected in the acceleration column selection, it is treated as one-dimensional motion, and trajectory plotting is not possible.